
Industrial process monitoring has moved far beyond monthly reports and dashboard screenshots. In stable production environments, it works as an early warning system for quality loss, hidden downtime, traceability gaps, and process drift across supporting equipment.
That matters because auxiliary systems often decide whether the main line performs as expected. Cleaning residue, coding failure, unstable vacuum, batching deviation, or poor coating consistency can all damage output before larger problems become visible.
A practical KPI framework helps connect those risks to daily decisions. The goal is not to collect more numbers, but to track the few indicators that show whether production remains repeatable, compliant, and commercially reliable.
Why KPI selection matters in process-support systems
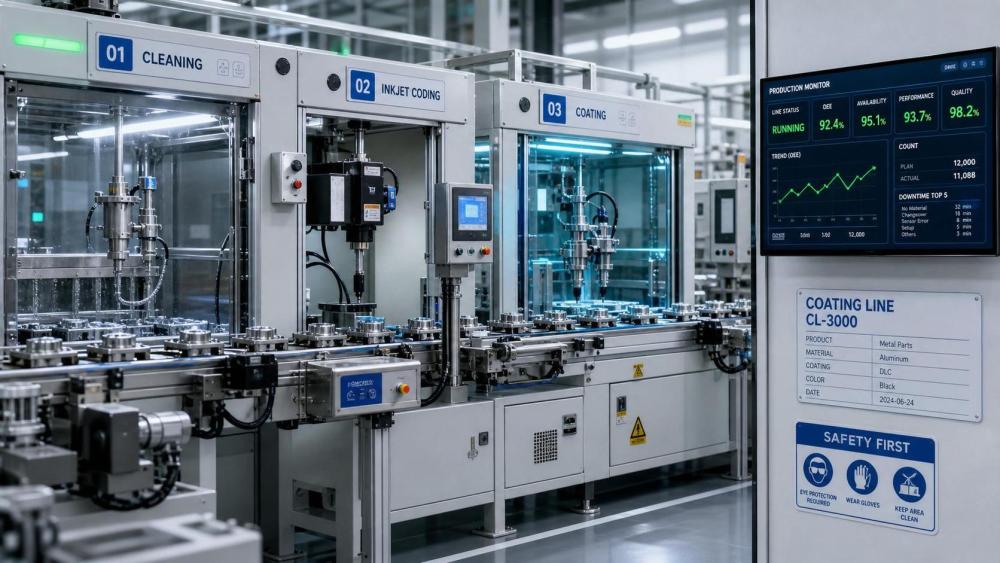
In advanced manufacturing, industrial process monitoring should reflect process health, not just machine activity. A running system may still be producing unstable results if critical parameters drift outside acceptable windows.
This is especially true in ultrasonic cleaning, laser marking, inkjet coding, weighing and batching, vacuum control, surface treatment, and electrostatic coating. These systems support quality at a microscopic or process-dependent level.
GIAS highlights this broader view well. Its industry coverage shows that production consistency depends not only on primary equipment, but also on the precision and stability of supporting processes.
When KPI selection is weak, teams often monitor easy values such as runtime or output count. Those numbers are useful, but they rarely explain contamination, unreadable codes, recipe errors, vacuum instability, or coating defects.
The KPIs that reveal stable production
The most useful industrial process monitoring indicators usually fall into five groups. Together, they show whether a process is capable, controlled, and economically stable.
1. Process parameter stability
This is often the first KPI layer to check. It tracks whether core process settings stay within defined tolerance during operation, not only at startup.
- Ultrasonic cleaning: frequency stability, power density, bath temperature, contamination load
- Laser marking: pulse consistency, focus position, line speed, marking contrast
- Inkjet coding: droplet formation, nozzle condition, print density, drying performance
- Weighing and batching: dosing accuracy, repeatability, deviation by batch
- Vacuum systems: pressure setpoint stability, pump-down time, leak rate
- Coating lines: film thickness, curing temperature, electrostatic transfer efficiency
When these values fluctuate, defects usually appear later. Industrial process monitoring becomes valuable because it shows the shift before scrap rates rise.
2. First-pass quality rate
Stable production is not defined by total output alone. It is defined by how much output passes without rework, cleaning repetition, re-marking, re-batching correction, or coating touch-up.
First-pass yield converts technical performance into business meaning. It connects industrial process monitoring directly to labor use, material waste, delivery reliability, and margin protection.
3. Traceability integrity
In many industries, a process is not considered stable if product identity cannot be verified. This makes code readability, mark permanence, batch record completeness, and timestamp accuracy essential KPIs.
For coding and marking systems, a readable code rate is more meaningful than print volume. For weighing or batching lines, data integrity between recipe execution and recorded batch history is equally important.
4. Downtime by cause
Total downtime is too broad to guide action. A better KPI separates stoppages by root cause, such as nozzle clogging, vacuum leakage, unstable feeder input, bath contamination, or curing imbalance.
This turns industrial process monitoring into a decision tool. It shows whether investment should go into maintenance, operator control, process redesign, or supplier qualification.
5. Capability over time
A process can pass today and still be unreliable next month. Tracking trend-based indicators such as Cp, Cpk, drift rate, and alarm frequency helps measure long-term control.
This is where industrial process monitoring supports operational reliability, not just daily firefighting. The trend is often more useful than a single acceptable reading.
How KPI priorities change by application
Not every line should use the same KPI hierarchy. The right priorities depend on whether the main risk is contamination, identification failure, formula error, vacuum instability, or surface inconsistency.
A shared KPI dashboard may still work across sites, but the interpretation must stay process-specific. Otherwise, industrial process monitoring becomes too generic to improve performance.
What makes a KPI useful in real operations
A useful KPI changes a decision. That is a simple test, but it removes many decorative metrics from the discussion.
In practice, the strongest indicators usually share four characteristics.
- They relate directly to a known defect, compliance need, or cost driver.
- They can be measured consistently across shifts, products, or facilities.
- They trigger a defined response when values move out of range.
- They are visible early enough to prevent downstream losses.
This is where many monitoring projects struggle. Data collection expands, but escalation rules remain unclear. The result is more visibility without stronger control.
A tighter approach links each KPI to a threshold, owner, action window, and expected business effect. GIAS content often supports this evaluation by connecting technical data with application context and compliance expectations.
Common mistakes in industrial process monitoring
Some monitoring systems look sophisticated but miss the operating reality. Stable production usually suffers from a few repeatable mistakes.
Monitoring machine status instead of process outcome
A pump can be running while vacuum quality is unacceptable. A printer can be online while codes fail verification. Equipment status alone rarely proves process stability.
Ignoring trend behavior
Single-point readings hide slow deterioration. Industrial process monitoring becomes more powerful when trend lines expose drift before limits are breached.
Using the same limits for every product
Different materials, geometries, and compliance demands can require different KPI windows. A one-size-fits-all threshold often creates false alarms or missed defects.
Separating quality data from process data
The real value appears when defect records, machine logs, and parameter histories are read together. That link helps explain why unstable output occurred.
A practical next step for better monitoring
A sensible starting point is to map one critical auxiliary process from input to release. Then identify three to five KPIs that predict failure earlier than final inspection.
From there, compare live values, alarm history, quality escapes, and downtime causes. That exercise usually reveals whether the current industrial process monitoring setup measures what actually matters.
For organizations evaluating cleaning, coding, batching, vacuum, or coating performance, the next decision should focus on process-critical evidence rather than broad equipment claims. Better KPI discipline creates a clearer basis for supplier comparison, line improvement, and long-term production stability.